Short courses in biostatistics, written from real studies
Written and taught by the statisticians at Red Door Analytics, who use these methods on client studies. Every practical generates a dataset for you alone and marks each value you report against what that data actually supports.
 Hannah Bower-Kähäri, PhDDirector of Applied Biostatistics
 Michael Crowther, PhDCEO & Director of Statistical Methodology
 Sara Ekberg, PhDAssociate Director of Applied Biostatistics
Choose a course
Free to work through, start to finish. The ones marked coming soon are not open yet.
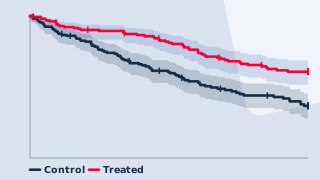
Survival analysis
An introduction to concepts, methods & software
Taught by Hannah Bower-Kähäri, PhD
5.6 h · 10 lessons · 4 practicals
Self-paced · reading, no video
Free
See the course →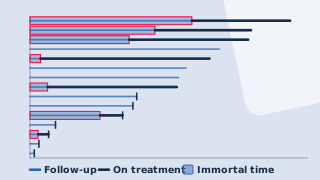
Immortal time
Person-time counted towards a treatment nobody was on yet — how to see it, measure it, and fix it two ways.
Taught by Michael Crowther, PhD
Self-paced · reading, no video
Dates to be confirmed
Register your interest →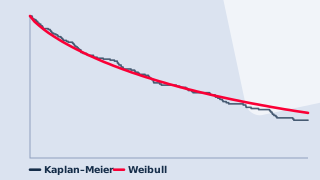
Fitting models with merlin
One command, a grammar, and the models it lets you write.
Taught by Michael Crowther, PhD
reading, no video
Dates to be confirmed
Register your interest →Coming soon
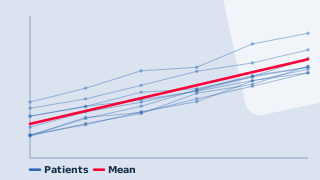
Longitudinal data and mixed-effects models
Measure the same person twice and the rows stop being independent. The model has to say so.
Taught by Michael Crowther, PhD
Self-paced · reading and video
Dates to be confirmed
Register your interest →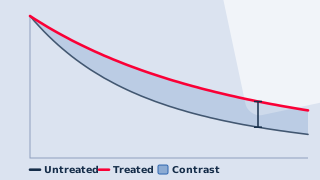
Introduction to causal inference
What a comparison of treated and untreated people can and cannot say.
Dates to be confirmed
Register your interest →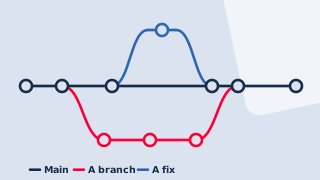
Version control with git
Keep every version of an analysis, share it, and go back.
Dates to be confirmed
Register your interest →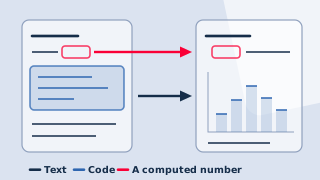
Reproducible documents with Quarto
One source for the analysis, the numbers and the report.
Dates to be confirmed
Register your interest →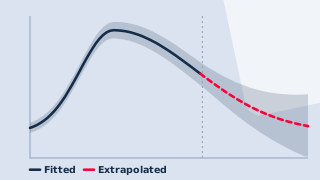
Flexible parametric survival models
Estimate the shape of the hazard, and report something a patient could use.
Taught by Sara Ekberg, PhD
Self-paced · reading and video
Dates to be confirmed
Register your interest →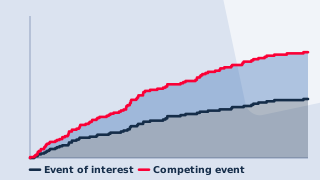
Competing risks
When more than one thing can happen first, and one of them stops the clock.
Taught by Michael Crowther, PhD
Self-paced · reading and video
Dates to be confirmed
Register your interest →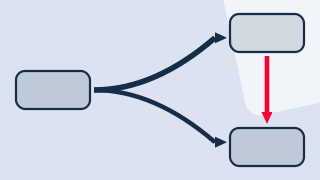
Multi-state models
More than one thing can happen, in more than one order, and people move between states rather than out of one.
Taught by Michael Crowther, PhD
Self-paced · reading and video
Dates to be confirmed
Register your interest →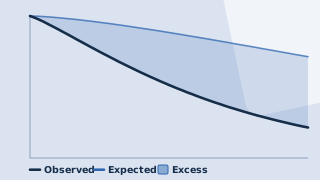
Relative survival and excess hazard models
Measure what a cancer does to a population when nobody can tell you the cause of death.
Taught by Sara Ekberg, PhD and Michael Crowther, PhD
Self-paced · reading and video
Dates to be confirmed
Register your interest →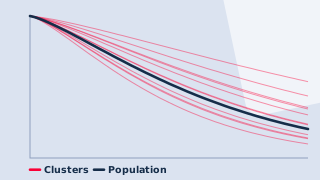
Multilevel and frailty survival models
Patients arrive in clusters and the clusters differ. A survival model that says nothing about that is answering a different question.
Taught by Michael Crowther, PhD
Self-paced · reading and video
Dates to be confirmed
Register your interest →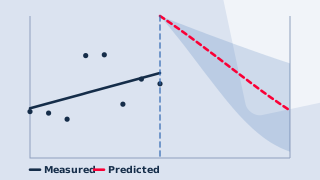
Joint modelling of longitudinal and survival data
A biomarker measured over time and an event it may be warning of, modelled together.
Taught by Michael Crowther, PhD
Dates to be confirmed
Register your interest →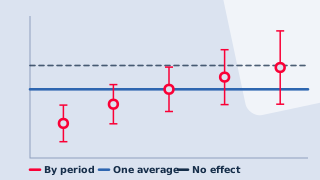
Causal inference and survival analysis
Causal questions with time-to-event outcomes: what the hazard ratio is and is not.
Dates to be confirmed
Register your interest →
Advanced multi-state modelling
Two clocks at once, everything else a fitted model will answer, and the health-economic value layer — the arithmetic of it, not a course in health technology assessment.
Taught by Michael Crowther, PhD
Self-paced · reading and video
Dates to be confirmed
Register your interest →One dataset, marked value by value
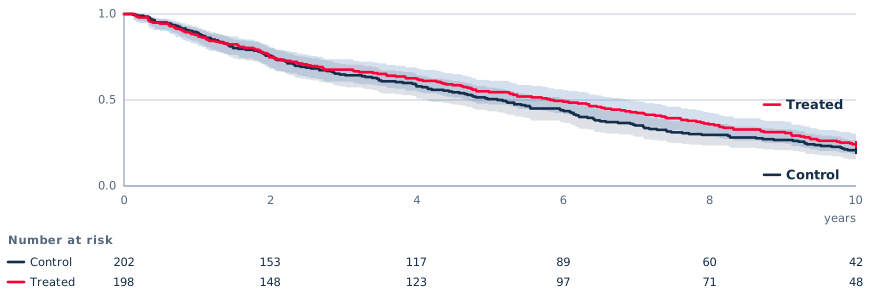
Every practical generates a dataset for you alone, like this one. Below it, one attempt at the survival course's first practical, and what the marker said about each value.
Every value is checked, and a wrong one is told why
One attempt at “Describing survival data”, the survival course's first practical, on the dataset from seed 4254018821. It divided person-time by 12, though survtime is already in years. This is what the marker said.
The marker’s answer2 of 4 right
- ✓Total number of events310
- ✗Total person-time at risk183.5
Named mistakeTwelve times too small. survtime in your file is already in years, and you have divided it by 12.
- ✗Event rate per 1000 person-years1689.58
Named mistakeTwelve times too large — this follows from the person-time: divided by 12, it makes every rate twelve times what it should be. Fix that and this comes right with it.
- ✓Rate ratio, treated versus control0.8959
Marked again by the same marker, person-time as in the file.
Each learner's dataset comes from their own seed, so every attempt is marked on numbers nobody else has.
The people behind the courses
Every course is taught by a statistician at Red Door Analytics who uses these methods in their own work on real studies.
Several years of experience with register-based epidemiological data, leading the applied team.
- register-based epidemiology
- flexible parametric survival
- loss in life expectancy
- teaching
Formerly Associate Professor of Biostatistics at the University of Leicester, and the author of the merlin framework.
- survival analysis
- joint models
- multi-state models
- statistical software
Over 15 years of experience in register-based epidemiological research, and a lecturer with a passion for teaching statistics to non-statisticians.
- cancer survival
- survivorship
- register-based research
- teaching
Tell us what you need
We run these courses through the year and design bespoke ones for teams. Leave your details and we will tell you when the next one is confirmed.